> ## Documentation Index
> Fetch the complete documentation index at: https://docs.leadpipe.com/llms.txt
> Use this file to discover all available pages before exploring further.
# Analytics dashboard
> Read traffic, quality, and credit usage from the Leadpipe dashboard
## Overview
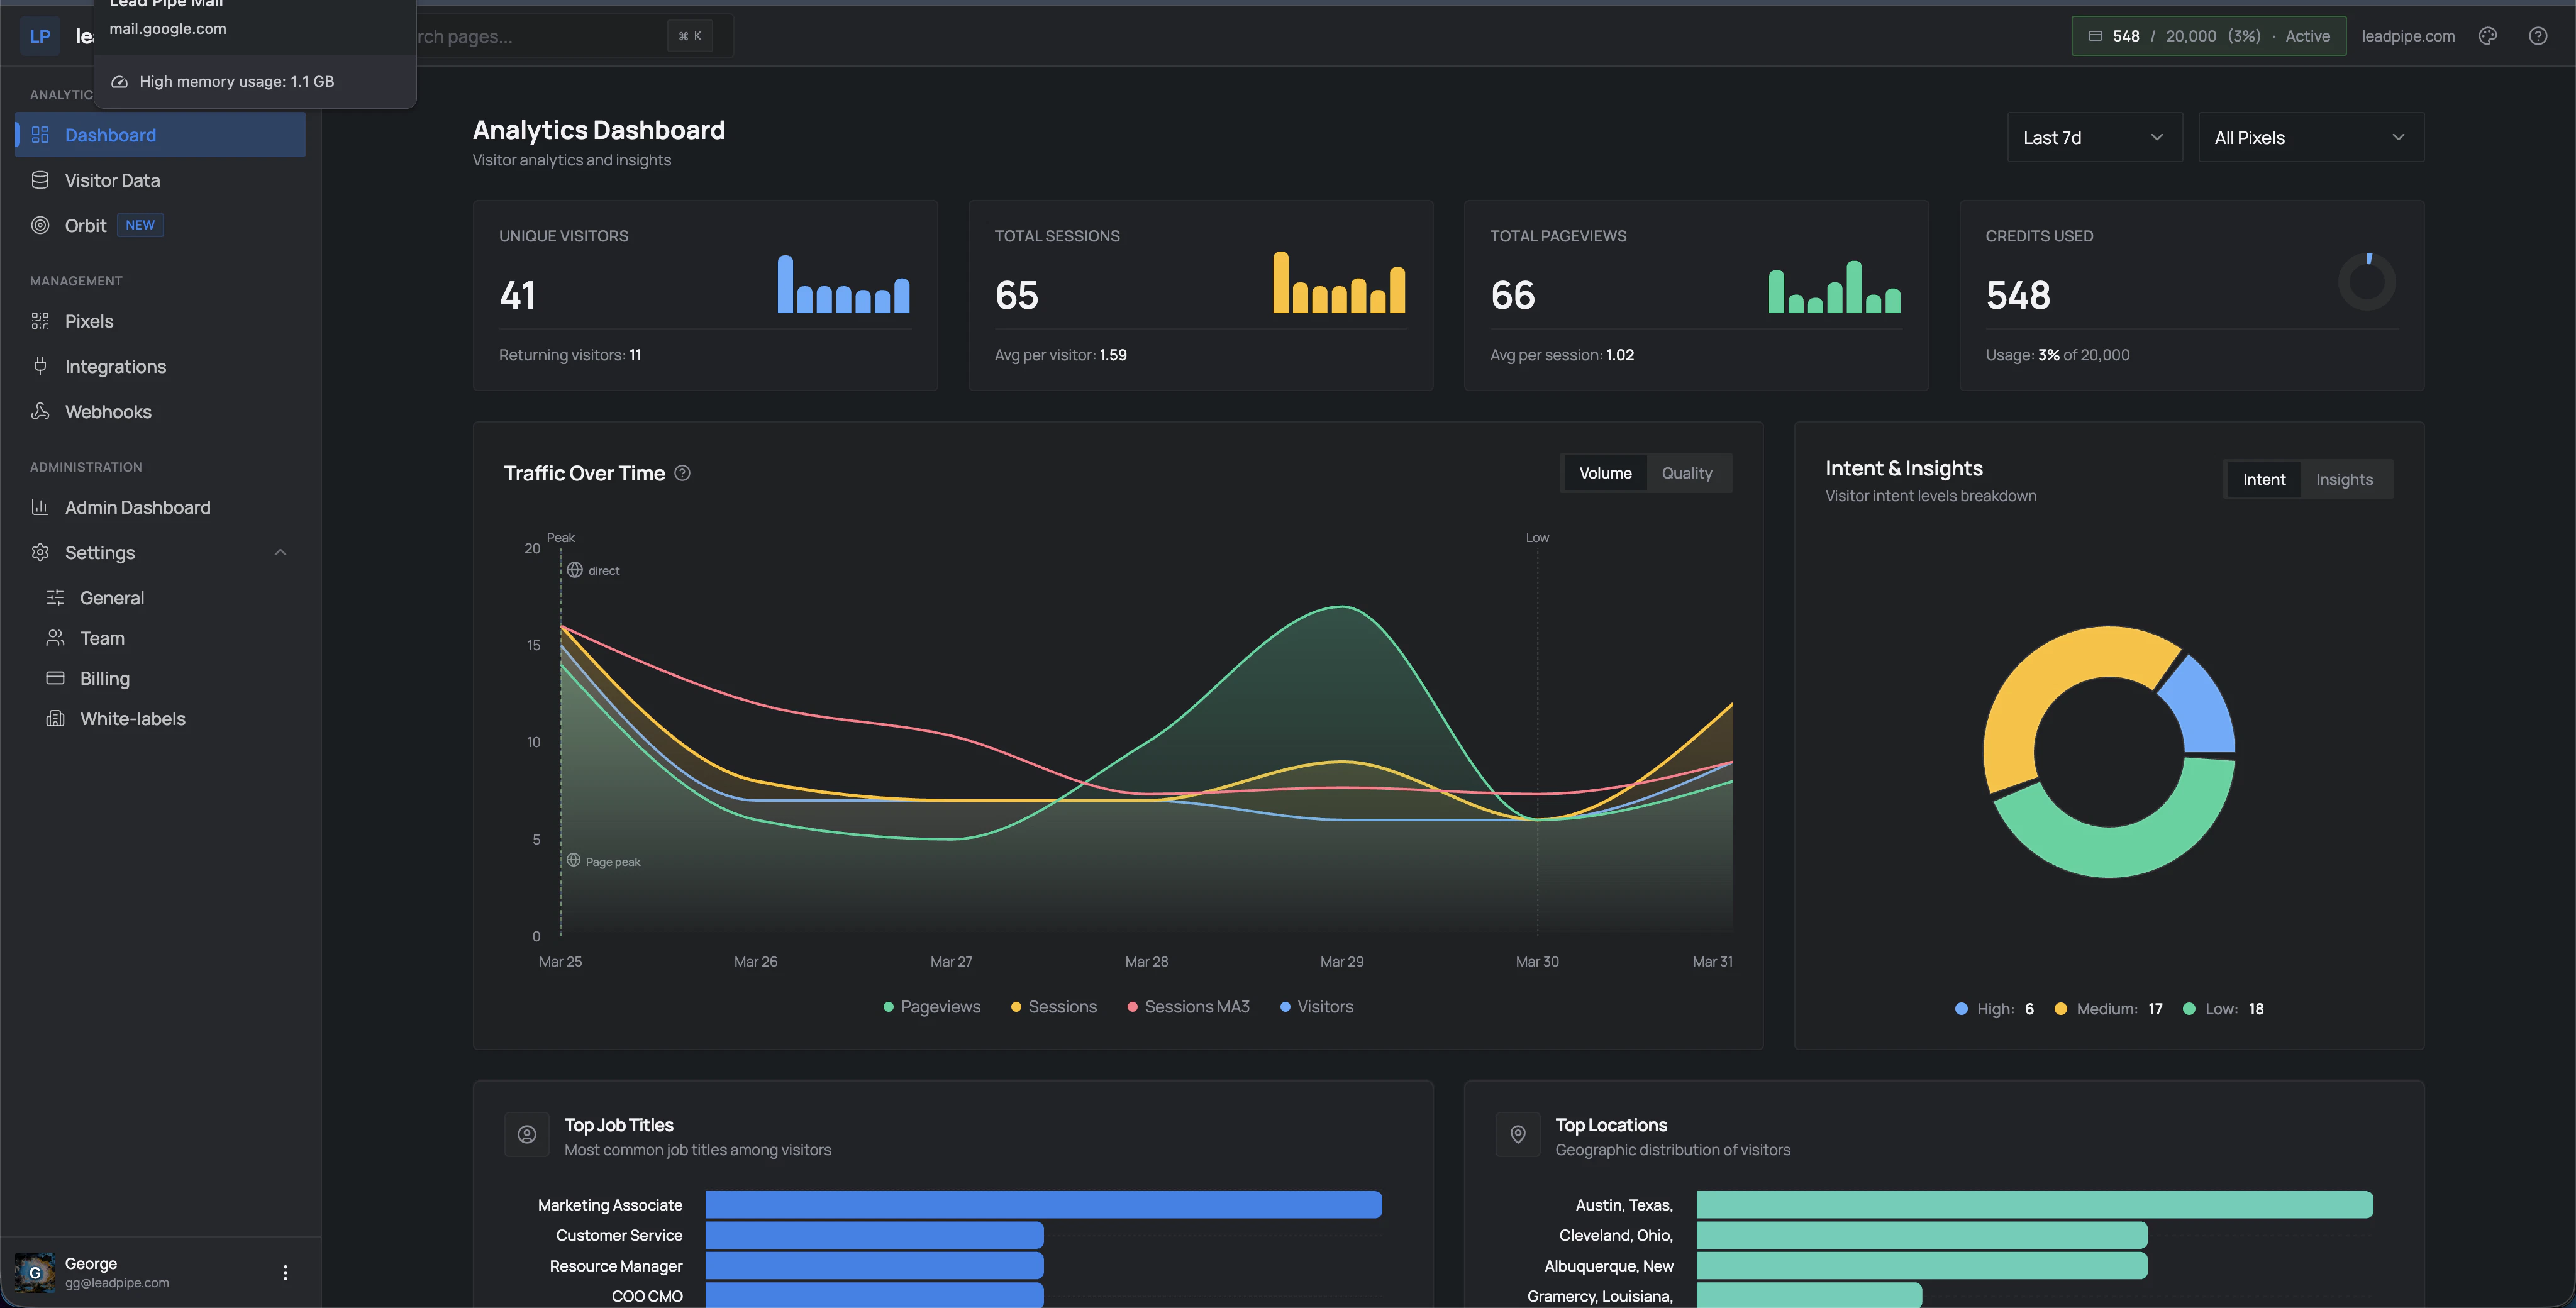
The **Analytics Dashboard** gives you the fastest read on whether traffic is flowing, how active it is, and whether the mix looks healthy.
 ## What the top cards mean
| Card | What it tells you |
| ----------------- | ----------------------------------------------------------------------- |
| `Unique visitors` | How many distinct visitors Leadpipe saw in the selected range |
| `Total sessions` | How many sessions those visitors generated |
| `Total pageviews` | How many pageviews were captured |
| `Credits used` | How many credits were consumed and how much of your allowance is in use |
The top-right controls let you change both the date range and the pixel scope.
## Charts and breakdowns
This chart helps you see whether activity is stable, rising, or dropping over the selected period. The dashboard also exposes `Volume` and `Quality` views so you can compare raw activity with the health of the traffic mix.
The intent donut breaks visitors into `High`, `Medium`, and `Low` intent buckets for the selected range.
This shows the most common roles appearing in the traffic, which helps you judge whether the audience matches your target buyer.
This shows where visitors are concentrated geographically.
The dashboard can also surface which companies visited, which URLs attracted attention, and where the traffic came from, including tagged sources and common channels such as Google Ads, Facebook, referrals, and direct traffic.
## What to look at first
* Check `Credits used` to make sure the traffic mix is healthy
* Check `Traffic over time` to confirm collection is steady
* Check `Top companies` and `Top job titles` to see whether the right audience is reaching the site
* Check `Top URLs` to understand which pages are pulling the strongest visitor activity
* Check `Source` patterns to see which channels are bringing the best traffic
## What a healthy dashboard review looks like
* traffic is showing up for the right pixel and date range
* sessions and pageviews move in a believable way
* the intent mix matches the kind of traffic you expect
* credits are not being burned on noisy traffic
## Next steps
* Read [Use visitor insights](/guides/use-visitor-insights) when you want to inspect the actual identified records behind the trends.
* Read [Suppress unwanted visitors](/guides/suppress-unwanted-visitors) if the dashboard shows too much noisy traffic.
## What the top cards mean
| Card | What it tells you |
| ----------------- | ----------------------------------------------------------------------- |
| `Unique visitors` | How many distinct visitors Leadpipe saw in the selected range |
| `Total sessions` | How many sessions those visitors generated |
| `Total pageviews` | How many pageviews were captured |
| `Credits used` | How many credits were consumed and how much of your allowance is in use |
The top-right controls let you change both the date range and the pixel scope.
## Charts and breakdowns
This chart helps you see whether activity is stable, rising, or dropping over the selected period. The dashboard also exposes `Volume` and `Quality` views so you can compare raw activity with the health of the traffic mix.
The intent donut breaks visitors into `High`, `Medium`, and `Low` intent buckets for the selected range.
This shows the most common roles appearing in the traffic, which helps you judge whether the audience matches your target buyer.
This shows where visitors are concentrated geographically.
The dashboard can also surface which companies visited, which URLs attracted attention, and where the traffic came from, including tagged sources and common channels such as Google Ads, Facebook, referrals, and direct traffic.
## What to look at first
* Check `Credits used` to make sure the traffic mix is healthy
* Check `Traffic over time` to confirm collection is steady
* Check `Top companies` and `Top job titles` to see whether the right audience is reaching the site
* Check `Top URLs` to understand which pages are pulling the strongest visitor activity
* Check `Source` patterns to see which channels are bringing the best traffic
## What a healthy dashboard review looks like
* traffic is showing up for the right pixel and date range
* sessions and pageviews move in a believable way
* the intent mix matches the kind of traffic you expect
* credits are not being burned on noisy traffic
## Next steps
* Read [Use visitor insights](/guides/use-visitor-insights) when you want to inspect the actual identified records behind the trends.
* Read [Suppress unwanted visitors](/guides/suppress-unwanted-visitors) if the dashboard shows too much noisy traffic.